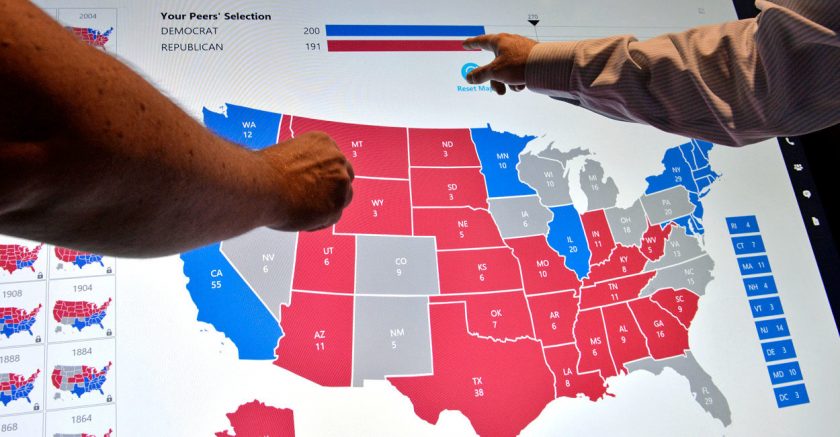
Will the 2018 elections be a wave against Donald Trump and the Republican Party? It depends upon how you define the word “wave.”
In a recent report I co-authored with political scientist Jacob Smith, Ballotpedia found that since 1918, wave elections occurred when the president’s party lost at least 48 House seats, seven Senate seats, seven gubernatorial seats, and 494 state legislative seats.
We defined wave elections as the 20 percent of elections in the last 100 years where the president’s party lost the most seats. Much like brokers using 20 percent stock fluctuations to determine bear and bull markets, we apply a similar methodology to wave elections. Not everyone will agree, but it provides a framework for furthering a concrete definition about wave elections.
For example, we arrived at 48 House seats by calculating the range of the 11 elections where the president’s party lost the most seats from 1918-2016 and making the lowest number the wave threshold. The range goes from 97 seats lost under Herbert Hoover (Republican) in 1932 to 48 seats lost under Lyndon Johnson (Democrat) in 1966 and Gerald Ford (Republican) in 1974.
Read the full story from The Daily Signal
Want more BFT? Leave us a voicemail on our page or follow us on Twitter @BFT_Podcast and Facebook @BluntForceTruthPodcast. We want to hear from you! There’s no better place to get the #BluntForceTruth.


